SPSS: Streudiagramm - Paul Borsdorf - University of Hamburg
Catalog
4255 Views
07.01.2021
SPSS: Streudiagramm
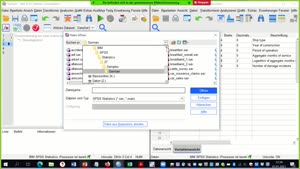
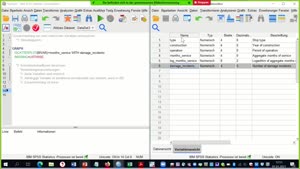
Es wird gezeigt, wie man zur graphischen Analyse des Zusammenhangs von zwei metrischen Variable in SPSS ein Streudiagramm erzeugt.
---
Hier finden Sie Videos zu den Grundlagen von SPSS.
Technical support
Please click on the link bellow and then fill out the required fields to contact our Support Team!
RRZ Support Link


